A governed intelligence layer for project decision‑making.
Foretrack AI turns project data, decisions, and history into earlier risk detection, executive clarity, and better outcomes on the owner's side of the table.
On projects, the bad news arrives too late to act on.
Signals exist across schedule, cost, and procurement but they're scattered, unprioritized, and surfaced weeks after the window to respond has closed.
of avoidable delay and rework that started as a signal nobody saw in time.
Risks seen too late
Signals exist, but aren't detected or prioritized early enough to change the outcome.
Recovery takes too long
Issues are discovered late, plans are unclear, and execution slows under pressure.
Executive time spent reacting
Leaders spend more time firefighting than driving the outcomes that matter.
Data siloed and underused
Project data, decisions, and history live in disconnected systems and spreadsheets.
Lessons not consistently applied
Insight from one project is rarely captured or reused on the next.
A governed intelligence workflow. Not just another dashboard.
Trusted data moves through six stages, from raw project signals to prioritized actions and the lessons your next project inherits.
Ingest
Connect trusted data from secure, owner-approved sources.
Analyze
Detect risks, issues, trends, and drivers across the project.
Benchmark
Compare against portfolio history and industry to find the gap.
Prioritize
Rank the open issues by impact and recommend where to focus first.
Act
Create recovery plans and take action with clear ownership.
Learn
Capture outcomes and feedback to improve the next project.
Watch a single long-lead risk move through all six stages.
What Foretrack tracks across the lifecycle.
Core modules monitor risk, readiness, performance, and partner reliability from procurement through turnover. Select one to explore.
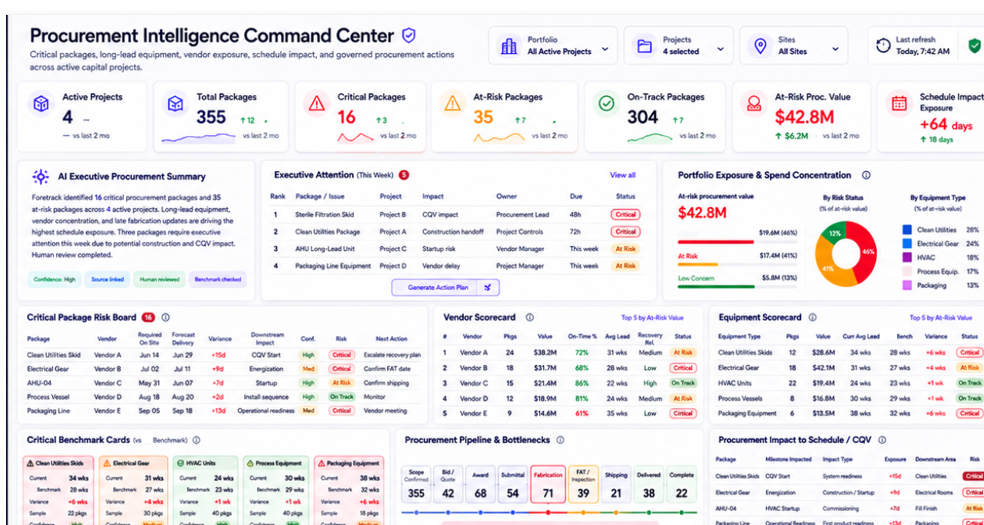
The whole capital program in one governed view.
From procurement to field execution every signal, benchmark, and recommended action in a single governed view, so leadership sees what's at risk and exactly what to do about it this week.
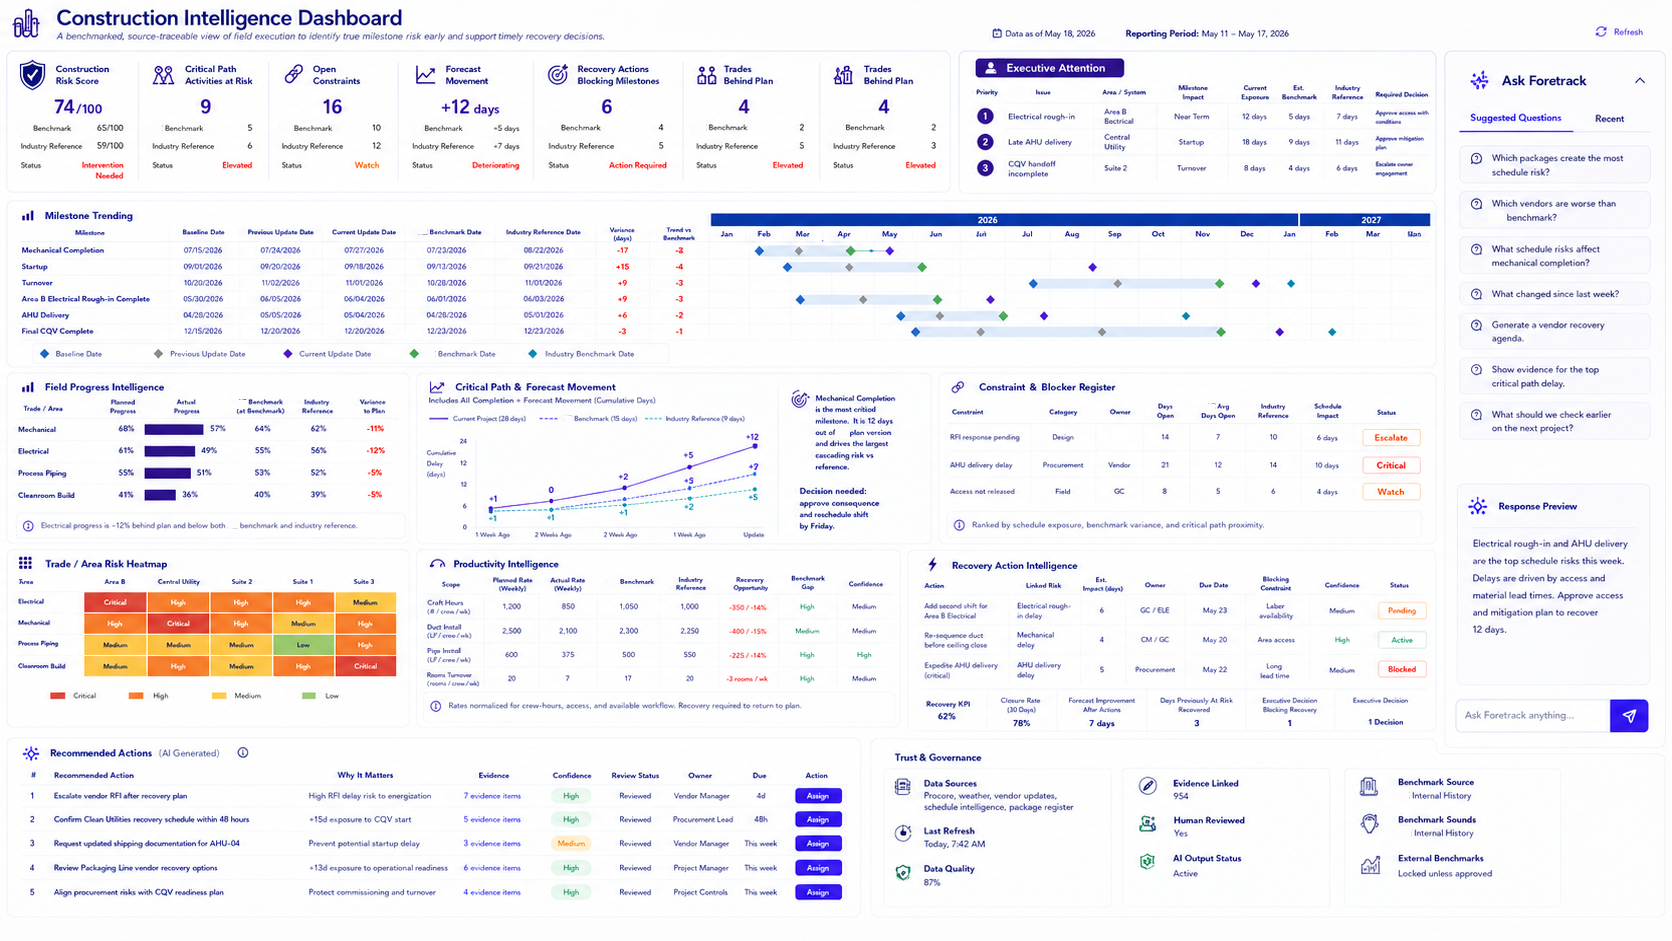
Benchmarked Risk Score
One governed score for true milestone risk, measured against your portfolio history and an industry reference.
Milestone Trending
Every milestone tracked against baseline, last update, and benchmark dates to catch slip early.
Recovery Intelligence
Open constraints and AI-drafted recovery actions, ranked by schedule impact with owners and dates.
Ask Foretrack
Ask in plain language; every answer is grounded in your project data and traceable to source.
Earlier insight. Better decisions. Measurable impact.
Foretrack closes the gap between what's happening and when leadership can act on it and proves the value in numbers.
What earlier looks like in the field.
A look at Foretrack on a live capital program surfacing risk sooner, quantifying exposure, and benchmarking every metric against history and the wider industry.
Illustrative figures from a biologics manufacturing pilot · client anonymizedThe same risk, surfaced 14 weeks sooner.
With Foretrack, the same long-lead procurement risk surfaced in week 24 instead of week 38: 14 weeks of runway to recover the schedule rather than absorb the delay.
Where the risk concentrates.
Of 355 packages, just 51 carry most of the exposure. Foretrack surfaces those first, so review time goes to the packages that actually move the schedule.
Every metric, in context.
A number means little without a baseline. Foretrack grades each project against portfolio history and an industry reference, so leaders see exactly where it stands.
Governed like a project controls system. Not a chatbot.
Foretrack AI is built with enterprise-grade guardrails to protect data, ensure compliance, and keep humans in control at every step.
Data Security
- Approved cloud boundary
- Org-scoped isolation
- Server-side credential handling
- No client-side API keys
AI Controls
- Grounded responses only
- Source citations required
- No training or data-sharing endpoints
- No fabrication
Human Governance
- Defined upload & access roles
- Human review before export
- UAT and sign-off
- Audit trail for every output
Every output is grounded in your data, cited to its source, and reviewed by a person before it leaves the room.
Foretrack costs a fraction of what overruns waste.
Independent research shows capital projects routinely run far over budget, and that data and analytics recover a meaningful share of that loss. Against those numbers, the Foretrack program is a rounding error.
Large capital projects typically finish up to 80% over budget and about 20 months behind schedule.
McKinseyAverage share of investment lost to poor project performance — about $114M for every $1B spent.
PMI · 2020Savings advanced analytics can produce in targeted areas of a capital project.
McKinseyWhat is at stake, and what Foretrack costs.
Sources. McKinsey, Imagining construction's digital future (2016) and Navigating the digital future (2017); McKinsey Global Institute, Decoding digital transformation in construction (2019); PMI, Pulse of the Profession (2020). Figures are modeled per $1 billion of capital deployed and are illustrative. Foretrack value is realized through earlier risk detection and reduced overruns, and the savings targets are validated in the pilot.
Start governed. Validate fast. Expand with confidence.
A practical, stage-gated path from alignment to a live pilot, with a clear decision point before any expansion into the next modules.
Align on the team
- Executive sponsor
- Project controls owner
- Weekly working cadence
Confirm the dataset
- 3–5 active projects
- Schedule, cost & change data
- Benchmark history where available
Stage 0 configuration
- Confirm taxonomy & KPIs
- Define governance & roles
- Align on success measures
Launch the pilot
- Configure operating model
- Launch executive attention
- Activate first modules
Pilot close + gate
- Validate outputs & adoption
- Review measurable value
- Make the expansion call
Flexible modules
- Design & cost
- Schedule & CQV
- GC & trade scorecards
- Pre-start
- Procurement
Stand up the foundation
- Configuration & governance
- Executive attention
- Procurement, benchmark & AI insights
Validate the first modules
- Independent cost intelligence
- Design intelligence
Operate across the lifecycle
- Construction intelligence
- CQV & turnover
Decide on full rollout
- Pre-start intelligence
- GC & trade scorecards
Bring us the project you're planning or the one that's already gone sideways.
Start with a focused pilot. Prove the value quickly. Expand only if the evidence supports it.